
 15/07/2022 | Admin

Bạn đang tự ôn thi IELTS Writing Task 1 tại nhà nhưng không biết nên bắt đầu từ đâu? Đừng lo lắng, bài viết này sẽ chia sẻ cho các bạn cách viết IELTS Writing Task 1 từ A – Z cho những người mới bắt đầu, chắc chắn sẽ giúp bạn cải thiện được kỹ năng viết của mình cho kỳ thi IELTS sắp tới.
Thông tin chung IELTS Writing
Phần thi viết trong bài thi IELTS Writing bao gồm 2 task. Trong đó IELTS Writing task 1 sẽ chủ yếu tập trung vào nội dung miêu tả biểu đồ, số liệu và sự thay đổi theo các xu hướng.
Kiểm tra phát âm với bài tập sau:

Thi sinh có 20 phút để viết bài task 1 với dung lượng tối thiểu là 150 từ. Do tính chất học thuật của bài viết, các bạn cần lưu ý các vấn đề như sau:
- Không đưa các ý kiến chủ quan hoặc những thông tin không có trong biểu đồ vào trong bài viết.
- Tránh sử dụng các đại từ thể hiện tính cá nhân như I, me, we trong bài.
- Trong bài viết không sử dụng các từ viết tắt, đặc biệt là những từ phủ định như don’t, doesn’t.
- Cố gắng sử dụng từ vựng và mẫu câu đa dạng, tránh lặp lại một cấu trúc câu hay một từ vựng nhiều lần trong bài.
- Phân bổ thời gian hợp lý và nên lập dàn ý trước khi viết.

Tiêu chí chấm điểm IELTS Writing
Bài thi IELTS Writing Task 1 được chấm điểm theo 4 yếu tố:
Task achievement
Bài viết đáp ứng được yêu cầu của đề bài, trả lời đầy đủ các vấn đề được đặt ra.
Coherence and cohesion
Bài viết có tính mạch lạc, có sự liên kết giữa các câu và các ý, sử dụng các từ nối phù hợp.
Lexical resource
Sử dụng vốn từ vựng phong phú, đa dạng và linh hoạt trong bài.
Grammatical range and accuracy
Sử dụng chính xác và kết hợp nhiều cấu trúc câu đa dạng, hạn chế lỗi chính tả và dấu câu trong bài viết.
>>> Xem thêm:
- Bằng ielts là gì? Các thông tin mới nhất cần biết về kỳ thi IELTS
- Tổng hợp hobby vocabulary IELTS giúp bạn đạt band 8.0 Part 1
Bố cục bài viết Writing Task 1
Bài viết IELTS Writing Task 1 thường được viết theo 4 đoạn văn như sau:
- Đoạn 1: Introduction (Mở bài)
- Đoạn 2: Overview (đây cũng chính là kết l
- uận bởi IELTS Writing Task 1 sẽ không có đoạn kết luận ở cuối bài)Đoạn 3: Body 1 (viết chi tiết về nhóm thông tin 1)
- Đoạn 4: Body 2 (viết chi tiết về nhóm thông tin 2)
7 dạng bài trong IELTS Writing Task 1
Đề bài IELTS Writing Task 1 có hai dạng chính là dạng biểu đồ và dạng không có biểu đồ (quy trình hoặc bản đồ).
Dạng biểu đồ bao gồm các số liệu tăng giảm, trong khi bản đồ hoặc quy trình chủ yếu tập trung vào mô tả và so sánh, hoặc thể hiện trình tự các bước.
Line Graph (Biểu đồ đường)
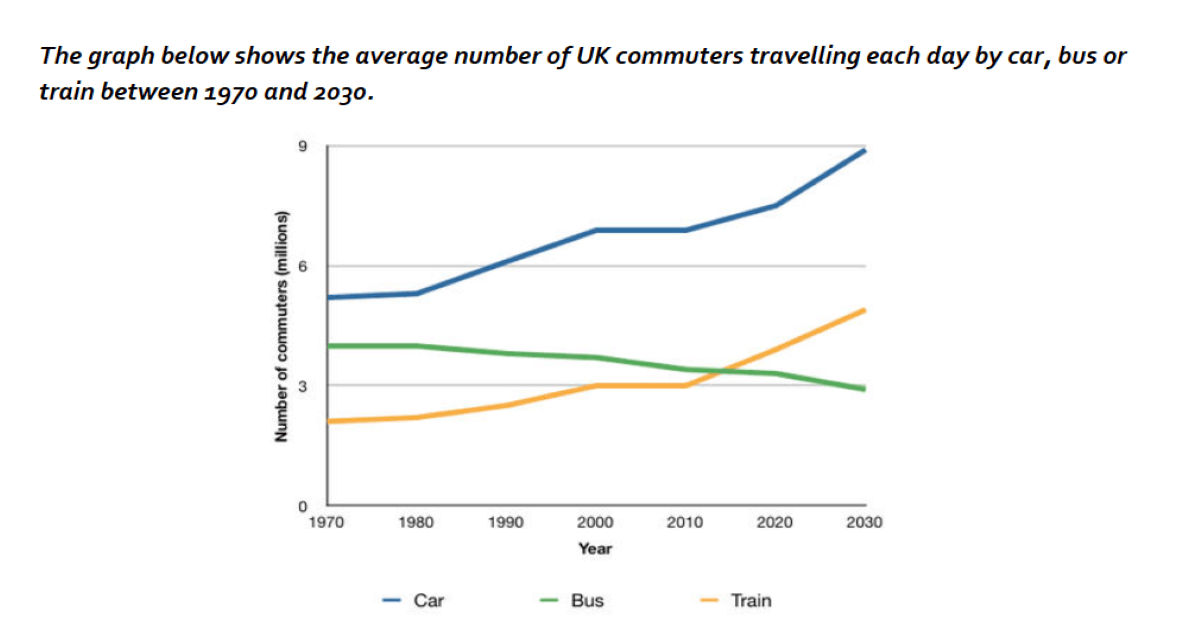
Line Graph là dạng biểu đồ đường. Biểu đồ này bao gồm một hoặc một số đường, mỗi đường thể hiện sự thay đổi theo một yếu tố thời gian nào đó (có thể là ngày, tháng, năm…).
Dạng biểu đồ đường bao gồm có hai trục: trục tung thể hiện cho các số liệu và trục hoành thể hiện các mốc thời gian.
>>> Đọc thêm: Speaking IELTS có mấy phần? Cấu trúc đề thi Speaking IELTS mới nhất
Bar Chart (Biểu đồ cột)
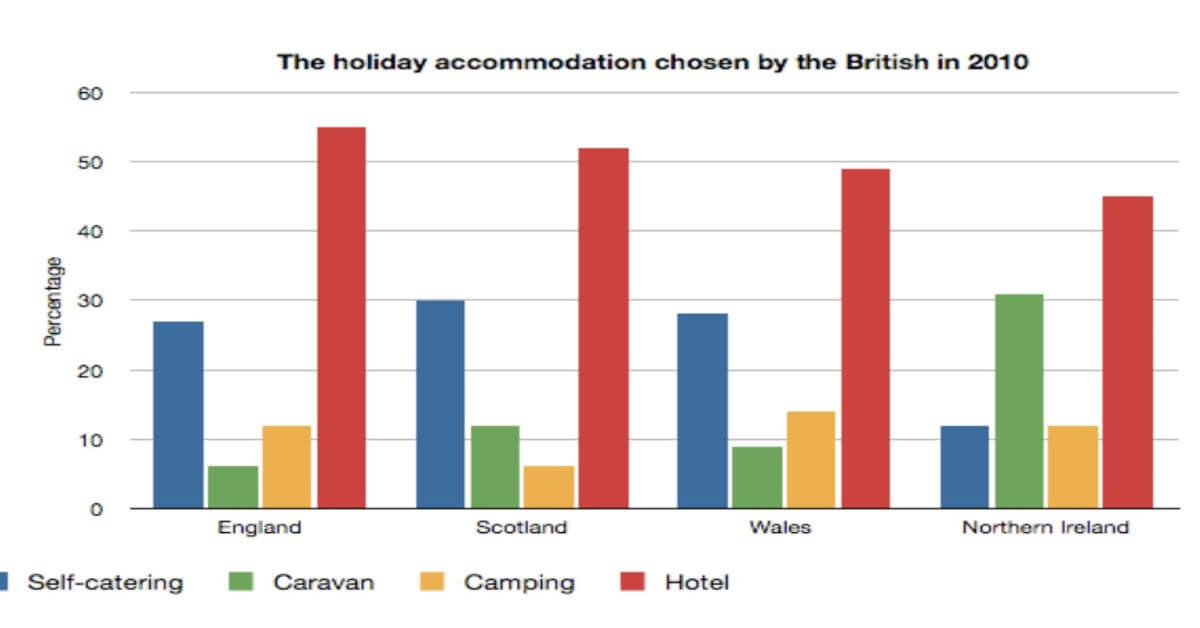
Dạng biểu đồ cột cung cấp lượng thông tin tương đối lớn, khiến việc phân loại và so sánh các con số khá phức tạp. Tuy nhiên, thí sinh chỉ cần tập trung vào những điểm nổi bật nhất. Chứ không cần phải mô tả tất cả số liệu để tiết kiệm thời gian.
Đối với dạng biểu đồ cột thì các bạn sẽ viết theo cấu trúc như sau:
- Mở bài: Paraphrase (viết lại kiểu khác nhưng vẫn giữ nguyên nội dung) câu đề bài.
- Khái quát chung: Câu nhận xét chung (điểm nổi bật nhất của biểu đồ).
- Đoạn thân bài: Miêu tả thông tin chi tiết.
Trong trường hợp đề bài có nhiều hơn một biểu đồ thì bạn chỉ cần miêu tả lần lượt theo trình tự. Nếu các biểu đồ có sự liên quan thì bạn nên thêm những phép so sánh để làm nổi bật bài thi của mình hơn.
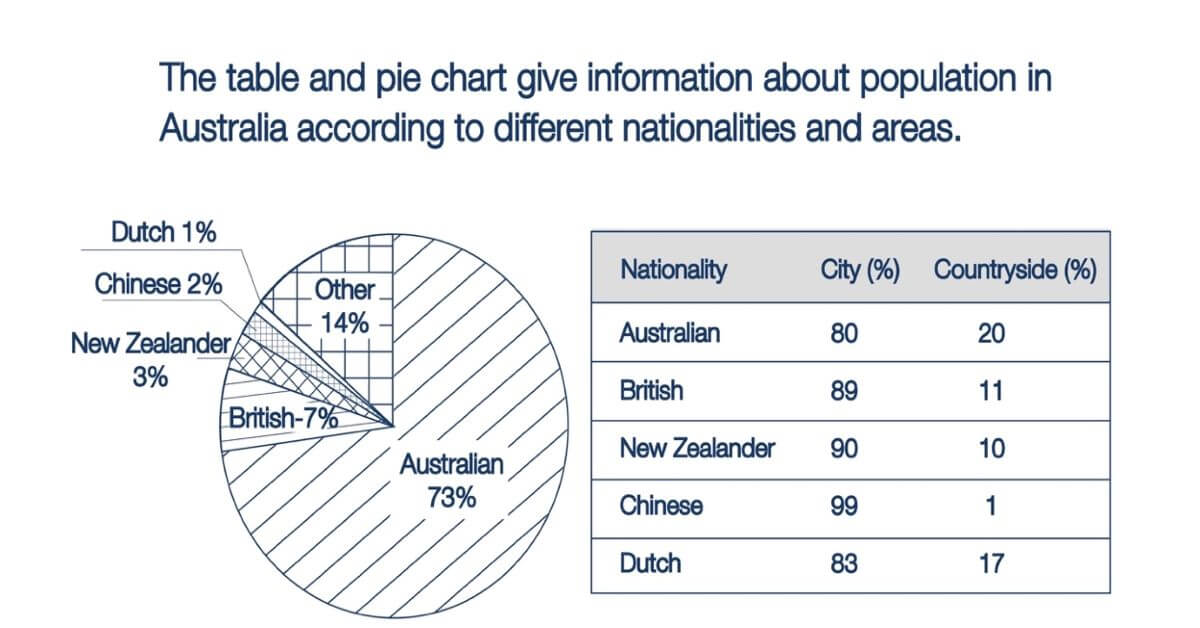
Pie Chart (Biểu đồ tròn)

Dạng Pie Chart cũng khá phổ biến trong bài thi IELTS Writing Task 1. Đây là dạng biểu đồ hiển thị trong một hoặc nhiều hình tròn nhằm so sánh các đối tượng một cách tổng thể.
Bên trong hình tròn được chia ra làm nhiều màu sắc khác nhau nhằm biểu thị cho từng số liệu cụ thể, diện tích của màu sắc càng to thì số liệu càng lớn, và ngược lại.
Dạng biểu đồ tròn sẽ thể hiện tỉ lệ phần trăm của một hoặc nhiều đối tượng. Thông thường, một đề bài dạng Pie Chart sẽ có từ hai đối tượng trở lên.
Khi gặp dạng bài này, bạn không nên quá tập trung vào miêu tả chi tiết. Thay vào đó, hãy cố gắng tóm tắt thật ngắn gọn các thông tin trong bài.
Table (Bảng số liệu)
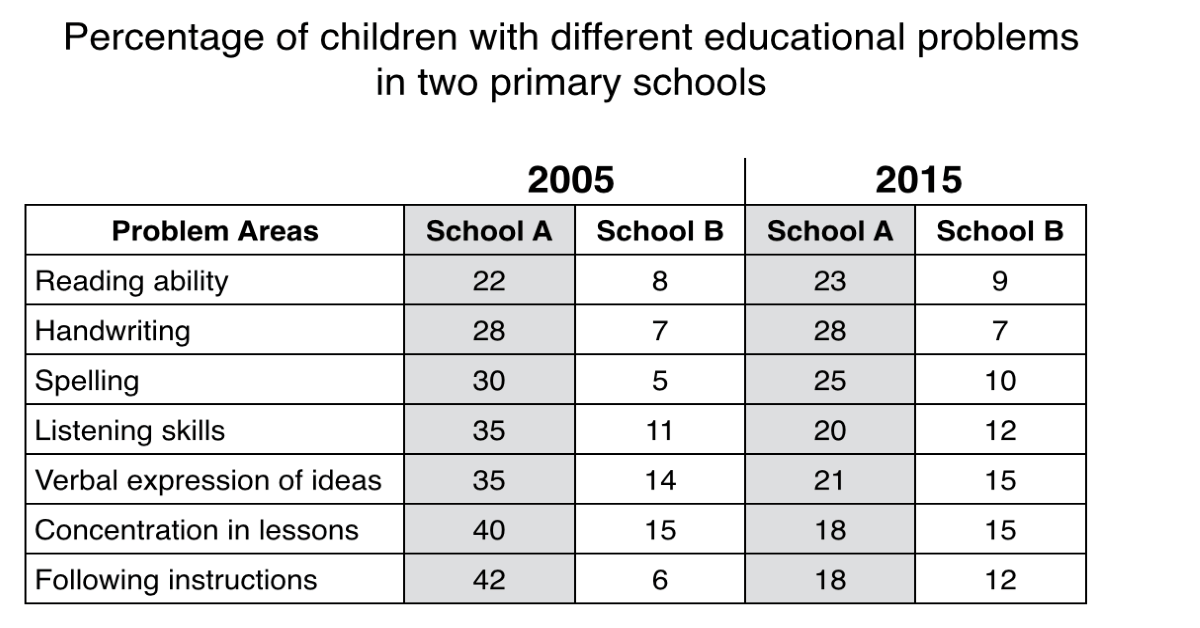
Bảng số liệu sẽ hiển thị các số liệu liên quan đến đối tượng, hạng mục một cách cụ thể. Tuy có hình thức khác dạng biểu đồ nhưng cách diễn đạt số liệu thì cũng tương tự như dạng biểu đồ.
Để tránh lan man khi làm bài, bạn cần nắm chắc những kỹ thuật so sánh và phân tích số liệu khi viết IELTS Writing Task 1. Ngoài ra, bạn cũng có thể tự linh động chuyển các số liệu đó thành loại biểu đồ dễ diễn đạt hơn cho mình.
Biểu đồ kết hợp (Mixed Charts)
Mixed Charts là dạng biểu đồ kết hợp giữa 2 loại biểu đồ, mỗi biểu đồ sẽ minh họa cho các kiểu thông tin khác nhau.
Thoạt nhìn thì có thể nghĩ dạng này tương đối khó, nhưng thực chất nó cũng được kết hợp từ các loại biểu đồ thường gặp như line graph, table, bar chart… Các biểu đồ này sẽ có mối liên kết với nhau, do đó các bạn chỉ cần đọc kĩ yêu cầu của đề bài và miêu tả lần lượt các thông tin như khi miêu tả một biểu đồ riêng.
>>> Đọc thêm: 8 cách nói Speaking IELTS trôi chảy, chinh phục thang điểm 7.0 cực kỳ đơn giản
Process (Quy trình)

Dạng này nếu như thí sinh đã nắm được cách trình bày thì cũng không quá khó viết. Để giải quyết đề bài IELTS Writing Task 1 dạng quy trình, bạn chỉ cần tập trung vào việc đa dạng cách viết bởi các số liệu đều đã được thể hiện toàn bộ trong đề.
Thông thường, các dạng Process thường gặp có thể là: Natural Cycle (Quá trình Tự nhiên), Man-made Process (Quá trình Nhân tạo) hoặc dạng kết hợp cả hai là Human-involved process (Quá trình có sự tác động của con người).
Cấu trúc bài viết dạng quy trình sẽ thường trình bày như sau:
- Mở bài: Paraphrase đề bài (tương tự như dạng bài biểu đồ)
- Khái quát chung: Khái quát về quy trình (bắt đầu và kết thúc là gì, gồm bao nhiêu giai đoạn…)
- Thân bài: Miêu tả từng bước trong quy trình bằng cách trình bày thứ tự (Ví dụ như Firstly, Secondly, Then, Next, Finally)
Maps (Bản đồ)

Cũng tương tự như các dạng bài trên, cách viết dạng maps IELTS Writing Task 1 cũng không quá khó. Tuy nhiên, bạn cũng cần nắm được cấu trúc viết bài dạng maps để thể hiện các nội dung tốt hơn.
- Mở bài: Paraphrase đề bài
- Khái quát chung: Mô tả những sự thay đổi nổi bật nhất giữa các bản đồ
- Thân bài: Mô tả cụ thể những thay đổi theo thời gian (cái gì được thêm vào, mất đi…)
Cách viết IELTS Writing Task 1
Phân tích đề bài
Trước khi bắt đầu vào viết bài, bạn hãy xác định đề bài IELTS Writing Task 1 thuộc dạng nào, có bao nhiêu mốc thời gian, thể hiện bao nhiêu đối tượng… Từ đó, bạn sẽ có thể triển khai nội dung bài viết một cách dễ dàng hơn.
Cách viết IELTS Writing Task 1 đoạn Introduction
Đây là đoạn mở đầu khi bạn viết Task 1, mục đích của đoạn này là nêu lại những thông tin đã được đưa ra trong đề bài. Bạn chỉ cần viết 1 đến 2 câu để chỉ ra biểu đồ này đang trình bày vấn đề gì vào mốc thời gian nào (nếu có) là được.
Ví dụ cụ thể như sau:
Đề bài:
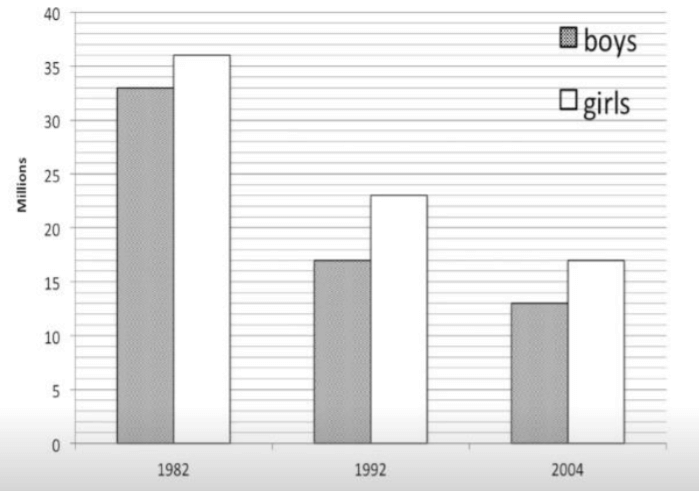
| The chart below shows the number of boys and girls taking advanced maths classes in American schools in three periods. |
Đoạn Introduction:
| The bar chart gives information about how many male and female school students participated in mathematics classes of an advanced level in the USA in 1982, 1992 and 2002. |
Cấu trúc paraphrase đề bài:
CHỦ NGỮ + TÊN HÌNH:
The/ the given /the presented / the supplied/ the provided/ the shown
+ the graph/chart/table/diagram
ĐỘNG TỪ:
gives information about/ shows/ illustrates/ represents/ depicts/comparespresents information about/ demonstrates/ sketch out/ summarises/ shows data about…
MÔ TẢ ĐỐI TƯỢNG:
the comparison of/ the differences/ the number of/ data about/ information on/ the amount of/ the changes/ the ratio of/ the percentages of/ the proportion of/ the trend of…
Ví dụ:
The chart gives information about consumer expenditures on six products in four countries namely Germany, Italy, Britain and France.
The bar graph and the table data depict the water consumption in different sectors in five regions.
Cách viết IELTS Writing Task 1 đoạn Overview
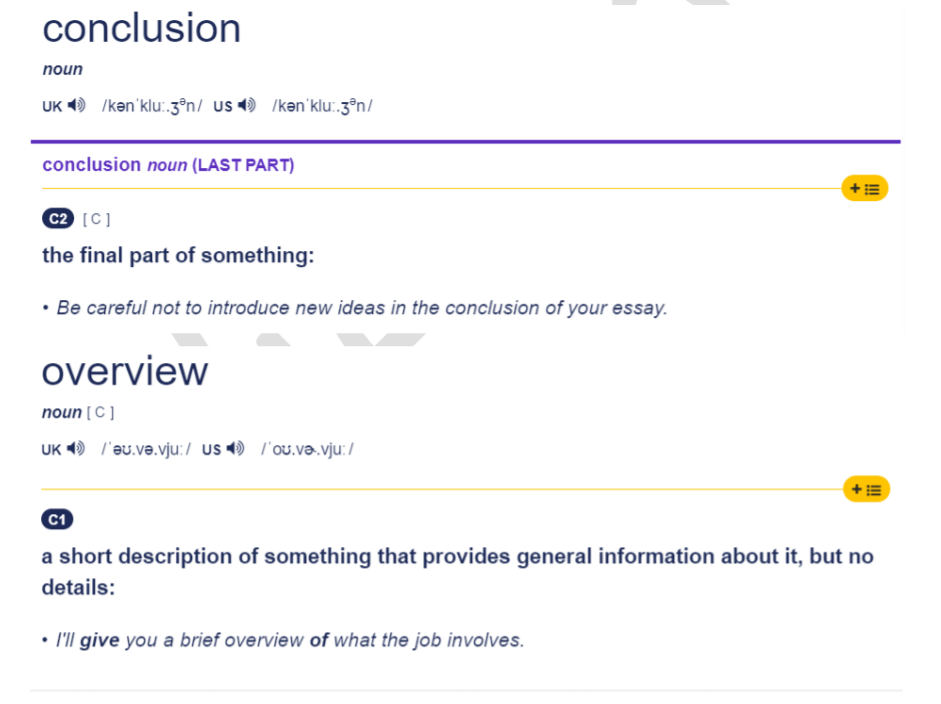
Đối với bài thi IELTS Writing Task 1, bạn sẽ không cần viết đoạn Conclusion (kết bài) ở cuối đoạn văn. Thay vào đó, bạn phải viết đoạn Overview (tổng quan). Vậy sự khác nhau giữa Conclusion và Overview trong bài là gì?
Theo từ điển Cambridge, Conclusion và Overview được định nghĩa như sau:
Dựa vào định nghĩa trên, chúng ta có thể hiểu hai khái niệm này như sau:
- Conclusion: nhận xét sau cùng và mang tính chất quyết định.
- Overview: mô tả tóm tắt ngắn gọn số liệu và thông tin chính về một đối tượng nào đó.
Vì vậy, đoạn Conclusion thường được viết ở IELTS Writing Task 2 để kết luận lại những luận điểm đã viết trong bài. Trong khi đó, đoạn Overview viết ở IELTS Writing Task 1 sẽ đáp ứng được yêu cầu đề bài đưa ra: báo cáo và chọn lọc những thông tin nổi bật trong biểu đồ.
Để viết đoạn Overview, bạn cần tìm được những đặc điểm nổi bật nhất trong biểu đồ hoặc hình vẽ.
Task 1 tuy có nhiều dạng biểu đồ, nhưng thường được chia làm hai loại như sau:
A. Change Chart:
Đây là các biểu đồ cho thấy sự thay đổi về số liệu trong một khoảng thời gian nào đó.
Đối với dạng bài này, các đặc điểm cần lưu ý đến là:
- Xu hướng chung của các đối tượng (tăng, giảm, dao động, …)
- Đối tượng có số liệu cao nhất/thấp nhất.
- Đối tượng có sự thay đổi mạnh nhất/nhẹ nhất.
- Khoảng thời gian có sự thay đổi mạnh nhất/nhẹ nhất.
B. Compare Chart
Đây là dạng biểu đồ chỉ thể hiện sự khác biệt về số liệu giữa các đối tượng, không có khoảng thời gian cụ thể hoặc chỉ có một mốc thời gian nhất định.

Trong dạng bài này, các đặc điểm chính mà bạn cần ưu tiên tìm là:
- So sánh giữa các đối tượng để phân nhóm miêu tả.
- Đối tượng có số liệu cao nhất/ thấp nhất.
>>> Đọc thêm: Tổng hợp các mẫu câu trả lời Speaking IELTS theo cấu trúc đề thi mới nhất
Cách viết IELTS Writing Task 1 đoạn Details
Đoạn Details hay còn được gọi là Body, là phần thân bài của IELTS Writing Task 1. Với thời lượng làm bài trong vòng 20 phút, bạn nên viết 2 đoạn cho phần thân bài.
Dựa vào các thông tin được tổng quát trong đoạn Overview, bạn cần tìm ra điểm tương đồng và khác biệt của các đối tượng để chia thành hai nhóm thông tin cho 2 đoạn thân bài.
Để dễ hình dung hơn, dưới đây là một bài viết mẫu đã phân đoạn cụ thể:
| The chart below shows the number of boys and girls taking advanced maths classes in American schools in three periods.Summarise the information by selecting and reporting the main features, and make comparisons where relevant. |
Write at least 150 words.

Introduction
The bar chart gives information about how many male and female school students participated in mathematics classes of an advanced level in the USA in 1982, 1992 and 2002.
Overview
Overall, it is clear that the number of students of both sexes studying maths decreased significantly over 32 years, with the biggest drop seen in the first decade, particularly for boys. However, although more girls attended advanced mathematics classes than boys in each period, the difference was relatively small throughout.
Body 1
In 1982, the number of female students attending high-level maths classes was the highest of both genders in any of the three years, standing at around 35 million. However, over the next 10 years, this figure fell dramatically to slightly less than 25 million and, by 2002, it had almost halved to around 17 million.
Body 2
In terms of boys, the trend followed the same downward pattern as the girls. However, while there were only slightly fewer boys enrolled in maths programs than girls in 1982 (just over 30 million), this number plummeted to around 15 million in 1992. In the final period, the decrease was a lot less dramatic, so the difference between the genders in 2002 was the same as it had been in 1982 (around 3 million).
(209 words)
Bài IELTS Writing Task 1 mẫu tham khảo
Bài mẫu dạng Line Graph
The graph below shows the proportion of the population aged 65 and over between 1940 and 2040 in three different countries.
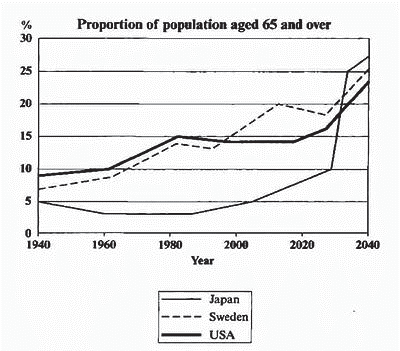
The line graph compares the percentage of people aged 65 or more in three countries over a period of 100 years.
It is clear that the proportion of elderly people increased in each country between 1940 and 2040. Japan is expected to see the most dramatic changes in its elderly population.
In 1940, around 9% of Americans were aged 65 or over, compared to about 7% of Swedish people and 5% of Japanese people. The proportions of elderly people in the USA and Sweden rose gradually over the next 50 years, reaching just under 15% in 1990. By contrast, the figures for Japan remained below 5% until the early 2000s.
Looking into the future, a sudden increase in the percentage of elderly people is predicted for Japan, with a jump of over 15% in just 10 years from 2030 to 2040. By 2040, it is thought that around 27% of the Japanese population will be 65 years old or more, while the figures for Sweden and the USA will be slightly lower, at about 25% and 23% respectively.
(178 words)
Bài mẫu dạng Bar Chart
The chart shows the proportion of renewable energy in total energy supply in 4 countries from 1997 to 2010.
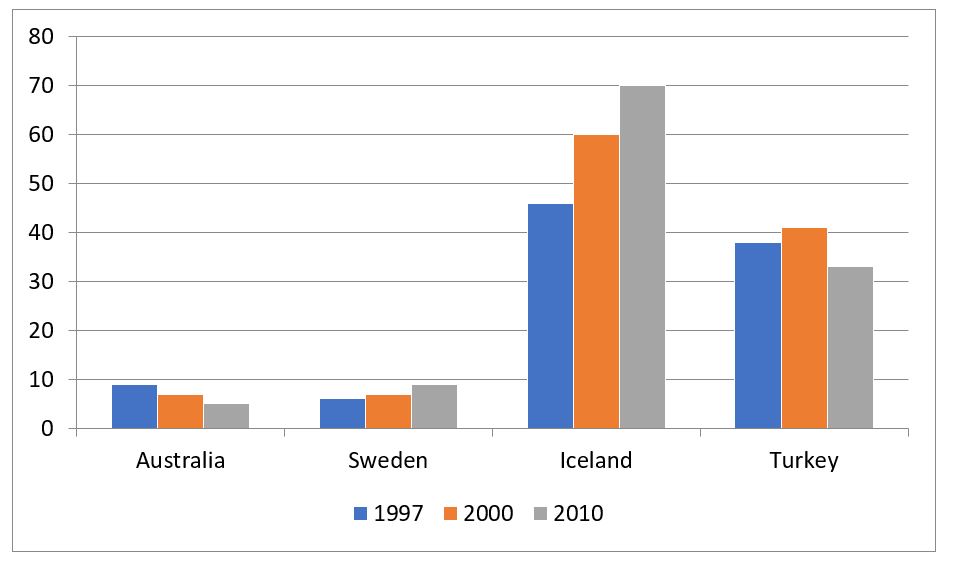
The given bar chart presents data about the percentages of renewable energy with regards to the total energy production in four different countries (Australia, Sweden, Iceland, and Turkey) in three years; 1997, 2000, and 2010.
Overall, Sweden and Iceland witnessed an upward trend in the use of renewable energy sources in the three examined years. It can also be seen that among the four countries, this type of energy was most popular in Iceland.
In 1997, almost half of the total energy produced in Iceland came from renewable resources. This figure continued to climb steadily to 60% in 2000 and more than 70% in 2010. Meanwhile, in 1997, only approximately 5% of the entire amount of energy produced was generated from natural resources in Sweden, which experienced a similar trend to that of Iceland in regards to the proportion of renewable energy produced.
Regarding Australia, nearly 10% of the energy supply was from renewable resources in 1997, and this figure decreased slightly to around 5% in 2010. Similarly, the percentage of renewable energy used in Turkey experienced a decline over the years from approximately 37% in 1997 down to just under 35% in 2010.
(193 words)
Bài mẫu dạng Pie Chart
The charts show the sources of electricity produced in 4 countries between 2003 and 2008. Summarise the information by selecting and reporting the main features, and make comparisons where relevant.
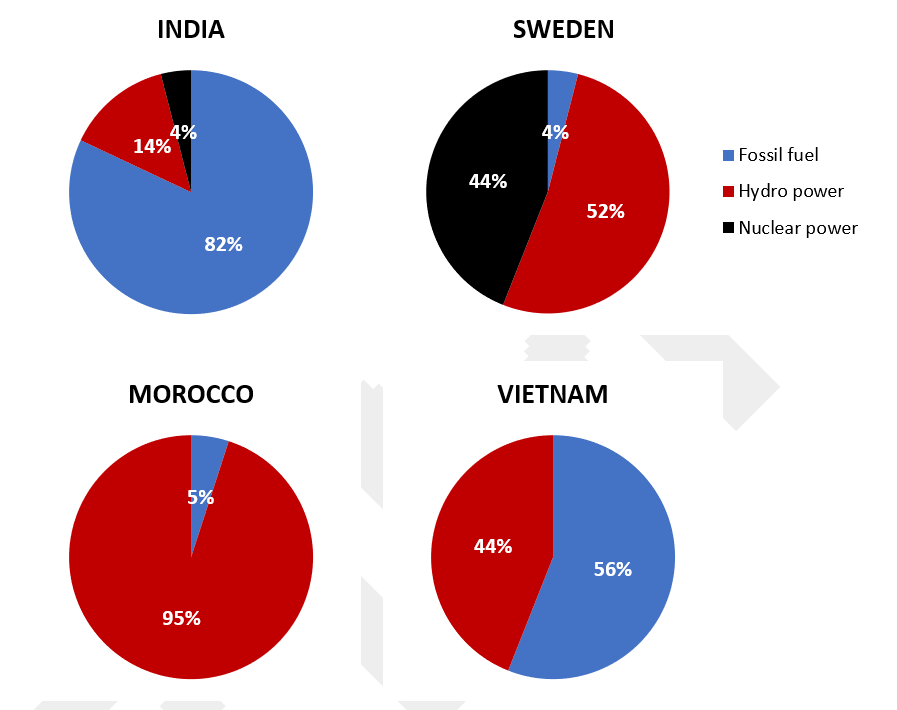
The given pie charts detail information about the proportion of three different sources of electricity in four countries (India, Sweden, Morocco, and Vietnam) from 2003 to 2008.
Overall, Vietnam and Morocco did not use any nuclear power for electricity production. It can also be seen that while fossil fuels were the largest source of electricity supply in Vietnam and India, they only occupied a relatively marginal proportion in Morocco and Sweden during the examined years.
In Vietnam, 56% of the total amount of electricity was produced from fossil fuels, while the figure for Morocco was only 5%. The rest of the electricity, in both nations, was produced solely from hydropower.
In India however, electricity from fossil fuels contributed to 82% of the entire quantity of electricity produced, which was also the highest figure for fossil fuel use among the four countries. Meanwhile, fossil fuels were only responsible for 4% of the total generated electricity in Sweden, with hydropower and nuclear power contributing 52% and 44% respectively.
(160 words)
Bài mẫu dạng Table
The percentage of people using various mobile phone features.

The table compares the percentages of people using different functions of their mobile phones between 2006 and 2010.
Throughout the period shown, the main reason why people used their mobile phones was to make calls. However, there was a marked increase in the popularity of other mobile phone features, particularly the Internet search feature.
In 2006, 100% of mobile phone owners used their phones to make calls, while the next most popular functions were text messaging (73%) and taking photos (66%). By contrast, less than 20% of owners played games or music on their phones, and there were no figures for users doing Internet searches or recording videos.
Over the following 4 years, there was relatively little change in the figures for the top three mobile phone features. However, the percentage of people using their phones to access the Internet jumped to 41% in 2008 and then to 73% in 2010. There was also a significant rise in the use of mobiles to play games and to record video, with figures reaching 41% and 35% respectively in 2010.
(178 words)
Bài mẫu dạng Mixed Charts
The charts below show reasons for travel and the main issues for the traveling public in the US in 2009.
The bar chart and pie chart give information about why US residents traveled and what travel problems they experienced in the year 2009.
It is clear that the principal reason why Americans traveled in 2009 was to commute to and from work. In the same year, the primary concern of Americans, with regard to the trips they made, was the cost of traveling.
Looking more closely at the bar chart, we can see that 49% of the trips made by Americans in 2009 were for the purpose of commuting. By contrast, only 6% of trips were visits to friends or relatives, and one in ten trips were for social or recreation reasons. Shopping was cited as the reason for 16% of all travel, while unspecific ‘personal reasons’ accounted for the remaining 19%.
According to the pie chart, the price was the key consideration for 36% of American travelers. Almost one in five people cited safety as their foremost travel concern, while aggressive driving and highway congestion were the main issues for 17% and 14% of the traveling public. Finally, a total of 14% of those surveyed thought that access to public transport or space for pedestrians were the most important travel issues.
(201 words)
Bài mẫu dạng Process
The diagram illustrates the process that is used to manufacture bricks for the building industry.
Summarize the information by selecting and reporting the main features and make comparisons where relevant.
The diagram explains the way in which bricks are made for the building industry. Overall, there are seven stages in the process, beginning with the digging up of clay and culminating in delivery.
To begin, the clay used to make the bricks is dug up from the ground by a large digger. This clay is then placed onto a metal grid, which is used to break up the clay into smaller pieces. A roller assists in this process.
Following this, sand and water are added to the clay, and this mixture is turned into bricks by either placing it into a mold or using a wire cutter. Next, these bricks are placed in an oven to dry for 24 – 48 hours.
In the subsequent stage, the bricks go through a heating and cooling process. They are heated in a kiln at a moderate and then a high temperature (ranging from 200c to 1300c), followed by a cooling process in a chamber for 2 – 3 days. Finally, the bricks are packed and delivered to their destinations.
(173 words)
Bài mẫu dạng Map
The two maps below show an island, before and after the construction of some tourist facilities
Summarise the information by selecting and reporting the main features and make comparisons where relevant.

The diagrams illustrate some changes to a small island which has been developed for tourism.
It is clear that the island has changed considerably with the introduction of tourism, and six new features can be seen in the second diagram. The main developments are that the island is accessible and visitors have somewhere to stay.
Looking at the maps in more detail, we can see that small huts have been built to accommodate visitors to the island. The other physical structures that have been added are a reception building, in the middle of the island, and a restaurant to the north of the reception. Before these developments, the island was completely bare apart from a few trees.
As well as the buildings mentioned above, the new facilities on the island include a pier, where boats can dock. There is also a short road linking the pier with the reception and restaurant, and footpaths connect the huts. Finally, there is a designated swimming area for tourists off a beach on the western tip of the island.
(175 words)
TỔNG KẾT
Trên đây là bài viết tổng hợp cách làm bài IELTS Writing Task 1 từ A đến Z cho người mới bắt đầu kèm theo bài mẫu giúp các bạn tham khảo. Để đạt được điểm số như mong muốn trong kỳ thi IELTS, bạn nên dành thời gian để nắm vững và luyện tập những kiến thức mà ELSA Speak chia sẻ phía trên nhé.